Bottom Up vs. Top Down Market Analysis: Two Lenses on Infrastructure Investment
When economists speak of “the U.S. drinking water market,” they are typically invoking a construct—a number derived by decomposing national aggregates into successively smaller slices until something resembling a sector estimate emerges. The method is elegant, widely understood, and, for many commercial decisions in infrastructure, insufficient.
At
FirmoGraphs, we take a fundamentally different approach. Rather than beginning with a macroeconomic aggregate and allocating downward, we construct our market view from the bottom up: cataloging individual capital projects, owner by owner, plan by plan, and building the picture of market activity from its constituent parts.
Both methodologies have intellectual merit. But they answer very different questions—and the distinction matters enormously for firms that design, build, or equip drinking water infrastructure.
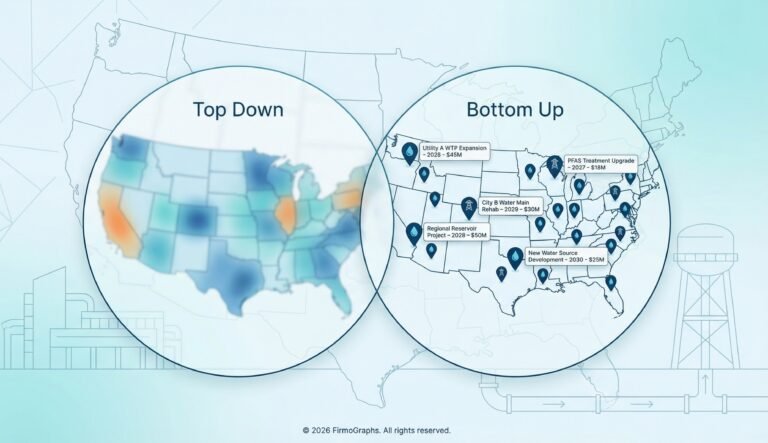
The Top Down Tradition
Conventional market sizing starts with broad indicators—national construction output, public works expenditure as a share of GDP, or federal appropriations data—and applies ratios and assumptions to derive a sector estimate. Drinking water capital spending might be expressed as a derivative of total utility construction, itself a fraction of public-sector fixed investment.
The approach offers macroeconomic coherence, speed of estimation, and the ability to identify long-run cyclical trends. But its limitation is resolution. A top down estimate can tell you that the drinking water sector is large and growing. It cannot tell you that a specific municipal utility in North Texas has revised its five-year capital plan downward by 23%, shifting investment from transmission toward treatment—the kind of intelligence that shapes whether a firm pursues a particular opportunity, mobilizes resources for a pursuit, or reallocates effort to a more promising geography.
The Bottom Up Alternative
At FirmoGraphs, we invert the process. We systematically collect Capital Improvement Plans, bond documents, and budget ordinances from municipal utilities, special districts, and regional authorities across North America. Individual projects are extracted, classified by business area (treatment, distribution, storage), de-duplicated across multi‑year phases, and aggregated by owner, geography, project type, or investment horizon.
The result is not an estimate in the conventional sense. It is an enumeration: the market expressed as the sum of its observable, documented capital commitments.
Where the Approaches Diverge
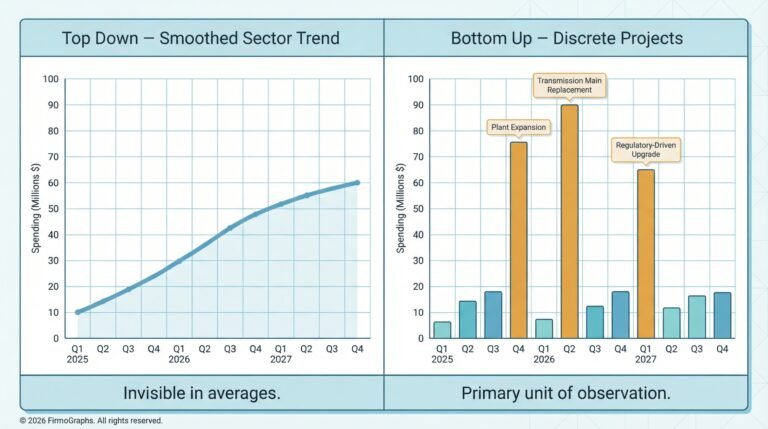
The divergence becomes most apparent in markets characterized by lumpiness—large, discrete investment events that dominate capital flows within a given geography. Regulated infrastructure markets like drinking water are textbook examples; a single plant expansion or transmission main replacement can shift a utility’s capital profile for years. These discontinuities are invisible in top down analysis, where they are smoothed into sector-wide averages. In bottom up analysis, they are the primary unit of observation.
| Question |
Top Down |
Bottom Up |
| How large is the national drinking water market? |
Defensible aggregate estimate |
Excels at granular composition |
| Which utilities are expanding treatment capacity? |
Silent |
Directly observable from capital plan data |
| Is metro-level investment accelerating or contracting? |
Requires proxy indicators |
Measurable through plan-over-plan comparison |
| Where should we allocate business development resources? |
Directional at best |
Supports specific account prioritization |
| Which projects involve regulatory-driven treatment upgrades? |
Cannot distinguish by type |
Identifiable by project classification |
Capital Improvement Plans are more than data sources—they are expressions of revealed preference by public-sector decision-makers, disclosing investment priorities, infrastructure condition assessments, regulatory responses, and funding expectations. Top down data tells you where the sector has been. Bottom up data tells you where specific owners intend to go.
At FirmoGraphs, we further enrich this intelligence by monitoring public-sector board meetings, extracting early signals about project intent and capital priorities from governance-level deliberations—before projects reach formal procurement.
What This Means for Firms That Design, Build, and Equip Water Infrastructure
Whether your firm engineers treatment systems, constructs pipelines, or manufactures the technology installed inside a plant, the commercial logic of bottom up intelligence is the same. The drinking water landscape is being reshaped by concurrent pressures—PFAS monitoring and treatment requirements, the revised Lead and Copper Rule, disinfection byproduct management, aging asset rehabilitation—each generating demand not for generic “water spending” but for specific projects at specific facilities on specific timelines.
Bottom up analysis makes this demand visible and actionable:
- Pursuit selection becomes evidence-based. Rather than allocating business development budgets on generalized sector optimism, firms can direct effort toward documented capital programs that match their capabilities and geographic presence. A PFAS treatment pilot, a filtration plant expansion, or a distribution main replacement program appearing in a CIP is not an abstraction—it is a quantifiable opportunity with a scope, a timeline, and an owner.
- Timing shifts from unknown to observable. Capital plans disclose when investment is expected, enabling firms to align capture strategies, staffing plans, teaming arrangements, and demonstration schedules with the owner’s planning and evaluation cycle—not after specifications have already been written.
- Geographic and subsector concentration becomes measurable. Bottom up aggregation reveals where capital investment is clustering: which regions face acute regulatory pressure, where aging infrastructure is driving rehabilitation programs, or where treatment technology upgrades are budgeted at scale. This intelligence supports territory planning, local presence decisions, and resource deployment with far greater precision than any national average can provide.
- Early engagement expands influence. The firms that position themselves during planning and budgeting—not after an RFP is posted—have the greatest influence over project scope, technology selection, and teaming structures. Bottom up intelligence identifies this engagement window by revealing when projects enter the capital planning pipeline, often years before formal solicitation.
- Growth narratives gain evidentiary weight. When a firm can quantify the project pipeline in its target markets—citing specific owners, dollar values, investment categories, and timelines—its growth thesis becomes substantially more credible to internal leadership, investors, and external stakeholders alike…. For firms accustomed to top down forecasts (“the PFAS treatment market will reach $X billion by 2030” or “water infrastructure spending will grow at Y% annually”), the bottom up view offers a fundamentally different lens: not the theoretical size of the opportunity, but the specific owners, projects, and timelines where that opportunity will materialize.
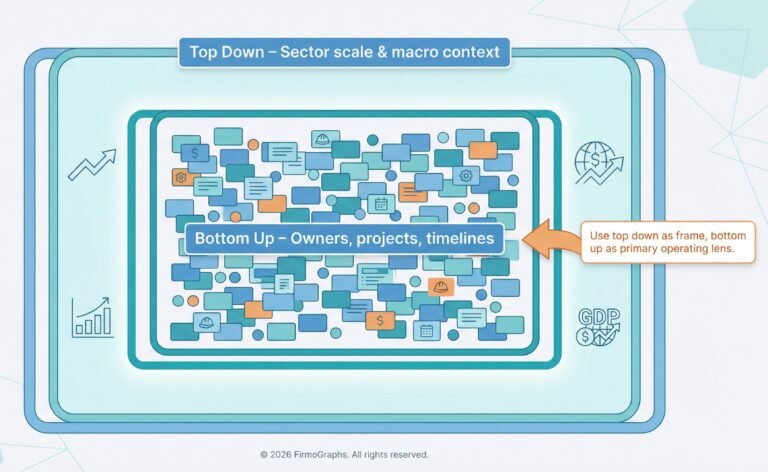
Reconciling the Two Views
Sophisticated market participants do not choose one methodology to the permanent exclusion of the other. Top down analysis sets the strategic frame—sector scale, growth trajectories, macroeconomic sensitivity. Bottom up analysis drives operational decisions—specific owners, specific projects, specific timelines. The most rigorous approach treats bottom up intelligence as the primary analytical lens and uses top down data as a reasonableness check and contextual frame.
Conclusion
The distinction between bottom up and top down market analysis is not merely methodological. It reflects a fundamental difference in what one chooses to observe: abstract aggregates, or the concrete investment decisions of individual infrastructure owners.
In regulated, long-cycle markets like drinking water—where capital formation is lumpy, geographically dispersed, and driven by regulatory mandate, asset condition, and public finance—the project-level view is not a supplement to macroeconomic analysis. It is the foundation upon which informed commercial strategy is built.
That is the work we do at
FirmoGraphs: transforming fragmented public information into structured, decision-ready insight, one capital project at a time.